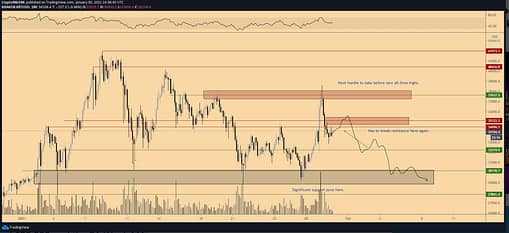
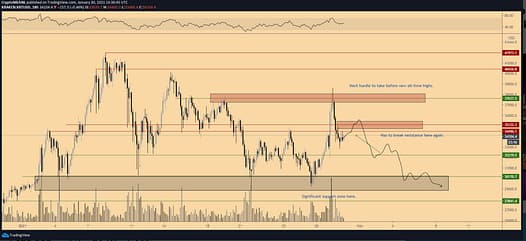
The levels that are critical to watch are highlighted in the chart above. Simply put, $38,000 must break for the rally to continue. Flipping this level for support opens the door to new all-time highs.
However, the surge couldn’t be sustained yesterday. After the $38,000 level’s failure, the $34,000 level couldn’t provide the heavily needed support for further upward momentum.
Therefore, the “Elon Musk pump” can be considered an outlier, and the general trend continues. This is a downtrend since the peak high at $42,000 that most likely will continue unless Bitcoin’s price can break through $34,500 and flip it into support.
The critical levels to watch are easy to see in the chart above. First, Bitcoin’s price has to reclaim the $34,500 level as support to sustain bullish momentum. If that happens, the level at $38,000 will be retested. Most likely, that test will result in a breakout above $38,000 toward the all-time high.
However, if Bitcoin’s price can’t break through $34,500, further downward momentum is likely, as the chart shows. In that perspective, the critical level to watch is the $30,000 region. If that fails to sustain support (after numerous tests already), I expect a drop toward $25,000 and the 21-Week MA.
Be careful with your trades!!


