📘 Crypto Guides & How-To Course
Step 10 of 16
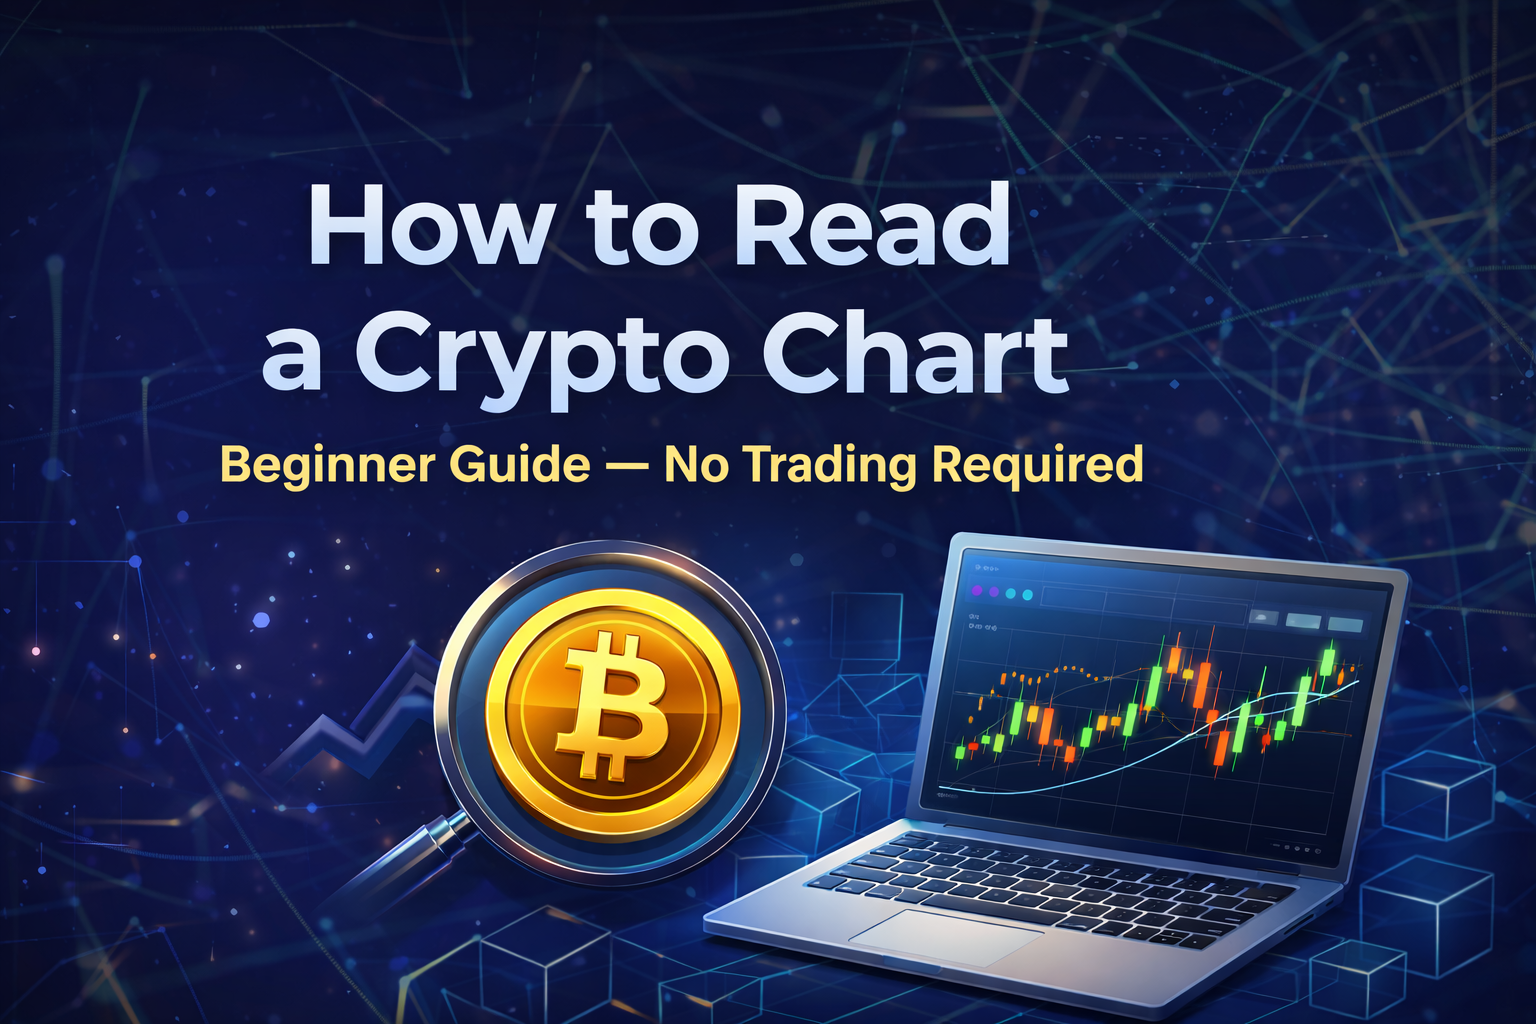
In this step, you’ll learn how to read a crypto chart without trading, guessing, or stressing.
This lesson is NOT about becoming a trader.
It’s about understanding what price charts are actually telling you — so you don’t panic, overreact, or fall for hype.
⬅️ Previous: Step 9 – How to Avoid Crypto Scams
➡️ Next: Step 11 – Market Cap vs Price (Why Cheap Coins Aren’t Cheap)
If charts confuse you, you’re normal.
Most beginners see crypto charts and think:
- “Is it too late?”
- “Should I buy now?”
- “Why is everyone panicking?”
Here’s the truth 👉 charts don’t predict the future.
They show human behavior — fear, greed, patience, and panic.
Once you understand that, charts stop being scary.
📊 What a Crypto Chart Really Shows
A price chart shows:
- Where price has been
- How people reacted there
- Where fear or confidence appeared
That’s it. No magic. No guarantees.
🕯️ What Is a Candlestick? (Plain English)
Each candle shows price movement over a time period.
It tells you:
- Open – where price started
- High – highest point
- Low – lowest point
- Close – where it ended
🟢 Green = price closed higher
🔴 Red = price closed lower
That’s all you need to know right now.
⏱️ Timeframes (Big Beginner Trap)
Charts can show:
- 5 minutes
- 1 hour
- 1 day
- 1 week
👉 Beginners should focus on DAILY or WEEKLY charts only.
Short timeframes = noise, stress, bad decisions.
🧱 Support & Resistance (No Lines Spam)
- Support = price floor (buyers step in)
- Resistance = price ceiling (sellers step in)
Think of it like:
- Support = the ground
- Resistance = the ceiling
Price remembers these areas.
🚫 What Beginners Should IGNORE
Avoid:
- “Guaranteed” indicators
- Overdrawn lines
- Influencers screaming “BREAKOUT”
- Anyone promising exact entries
If it sounds too confident → 🚩
✅ The Big Takeaway
Charts are for understanding, not predicting.
If you can answer:
- Is price calm or emotional?
- Is this panic or patience?
You’re already ahead of most people.
👉 What You Learned in Step 10
✔️ What charts actually show
✔️ What candles mean
✔️ Why timeframe matters
✔️ How to avoid emotional mistakes
⏭️ Next Step
➡️ Step 11 – Market Cap vs Price (Why Cheap Coins Aren’t Cheap)
This one saves beginners from buying traps.